Influencer Marketing KPI Guide: Essential Metrics That Drive ROI

Influencer marketing requires a data-driven strategy. Track reach, engagement, CTR, conversions, CPA, and ROI to measure performance. Monitor brand sentiment and share of voice for audience insights. Clear goals and analytics tools help optimize campaigns, improve partnerships, and drive stronger long-term business results.
Influencer marketing KPI has become a cornerstone of modern digital strategies, enabling brands to tap into authentic voices and reach highly engaged audiences. However, as investment levels and campaign complexity rise, simply partnering with favorite creators is no longer sufficient. Savvy marketers maust leverage data and analytics to unlock the full potential of their influencer initiatives. By tracking and optimizing the right metrics, brands can make informed decisions, refine targeting, allocate budgets effectively, and clearly demonstrate the return on investment (ROI) from every collaboration.
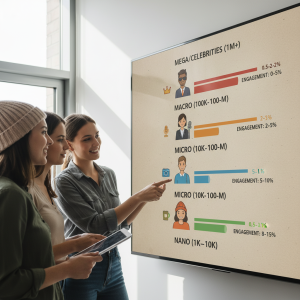
From impressions and engagement rates to sentiment analysis and cost per acquisition, these metrics cover both quantitative and qualitative dimensions of campaign effectiveness. We’ll also share tips on setting realistic goals, selecting the right analytics platforms, and translating data insights into actionable strategies. Whether you’re managing mega-celebrity partnerships or micro-influencer collaborations, tracking these metrics will help you maximize impact, optimize spend, and build stronger relationships with your audiences and influencer partners.
Reach and Impressions
Reach measures the total number of unique users who see your influencer’s content, while impressions represent the total views, including multiple exposures to the same user. High reach and impression counts indicate strong content visibility and audience penetration. Use native platform analytics—such as Instagram Insights, TikTok Analytics, or YouTube Studio—to track these metrics in real time. Comparing reach to impressions also reveals how frequently followers revisit or encounter shared content. By benchmarking these figures against previous campaigns or industry averages, you can set realistic visibility goals and choose influencers who consistently deliver broad exposure. Learn more about B2B Influencer Marketing
Engagement Rate
Engagement rate represents the percentage of an influencer’s audience that interacts with their content, including likes, comments, shares, and saves. Calculate engagement rate by dividing total engagements by total reach, then multiplying by 100. A high engagement rate indicates that content resonates with the audience and encourages interaction. Use tools like Sprout Social or Hootsuite Analytics to automate these calculations and compare engagement across different influencer collaborations. Keep in mind that micro-influencers often yield higher engagement rates due to more niche and loyal followings.
Click-Through Rate (CTR)

CTR tracks the percentage of viewers who click on a call-to-action link—such as a product page, landing page, or signup form—after viewing influencer content. Compute CTR by dividing clicks by impressions and multiplying by 100. This metric is critical for campaigns focused on driving traffic and lead generation. Implement unique UTM parameters in your influencer links to track clicks accurately in Google Analytics. By analyzing CTRs for different influencers and content formats, you can optimize calls to action, link placements, and creative styles to boost click performance.
Conversion Rate
Conversion rate measures the percentage of clicks that result in a desired action, such as completing a purchase, registering for a webinar, or downloading a guide. Calculate it by dividing conversions by total clicks and multiplying by 100. Integrate your influencer links with Google Analytics goals or e-commerce tracking to capture these conversion events. Monitoring conversion rates helps you evaluate the true business impact of each influencer partnership and informs budget allocation decisions. Conduct A/B tests on landing pages and promotional messaging to further improve conversion efficiency.
Cost per Acquisition (CPA)
CPA calculates the average cost required to acquire a customer or lead through your influencer campaigns. To determine CPA, divide the total campaign spend by the number of conversions. This metric enables a direct comparison of influencer performance based on cost efficiency. By benchmarking CPAs across different influencers or platforms, marketers can identify high-value partners, negotiate rates, and optimize budget distribution. Factor in both direct costs—such as influencer fees and ad spend—and indirect costs, including production expenses, to get a holistic view of acquisition economics.
Brand Sentiment
Sentiment analysis evaluates the tone of audience conversations surrounding your influencer campaigns, classifying mentions as positive, neutral, or negative. Tools like Brandwatch, Mention, or Sprout Social offer automated sentiment tracking across social media channels. By monitoring sentiment over the course of a campaign, brands can gauge public perception, address negative feedback quickly, and capitalize on positive buzz. Qualitative insights from sentiment analysis can guide creative adjustments, messaging tweaks, and influencer selection to maintain brand integrity and audience trust.
Audience Growth Rate
Audience growth rate tracks how rapidly your social media following expands due to influencer campaigns. Calculate it by dividing the number of new followers gained during the campaign by your initial follower count, then multiplying by 100. Comparing this to organic growth shows the incremental effect of influencer efforts. Use these insights to identify which influencers drive the most meaningful follower growth, refine partnership strategies, and prioritize collaborations that foster sustained community engagement over time.
Average Engagement per Post
While engagement rate provides a ratio, average engagement per post shows the raw number of interactions—likes, comments, and shares—each influencer generates. Compute this by dividing total engagements by the number of posts in the campaign. Average engagement helps set realistic performance benchmarks and enables more accurate forecasting of influencer output. When evaluating future collaborations, use this metric to estimate workload, expected interaction volumes, and potential campaign reach.
Share of Voice
Share of voice (SOV) measures your brand’s presence compared to competitors within the influencer marketing space. Calculate it by dividing your brand’s total mentions by the combined mentions of all relevant competitors, then multiply by 100. A higher SOV indicates greater visibility and influence. Tracking SOV across platforms helps optimize influencer selection, content strategies, and campaign tactics to increase market prominence and outperform competitors in audience engagement.
Return on Investment (ROI)
ROI is the ultimate metric for quantifying the financial return generated by your influencer marketing efforts. Calculate ROI by subtracting total campaign investment from revenue generated, dividing the result by investment, and multiplying by 100. Use tracking methods like promo codes, affiliate links, or e-commerce integration to attribute revenue accurately. For a more comprehensive view, consider customer lifetime value (LTV) to assess long-term benefits. Present ROI data to stakeholders to justify budgets, refine strategies, and secure future campaign investments.
Influencer Audience Demographics Analysis
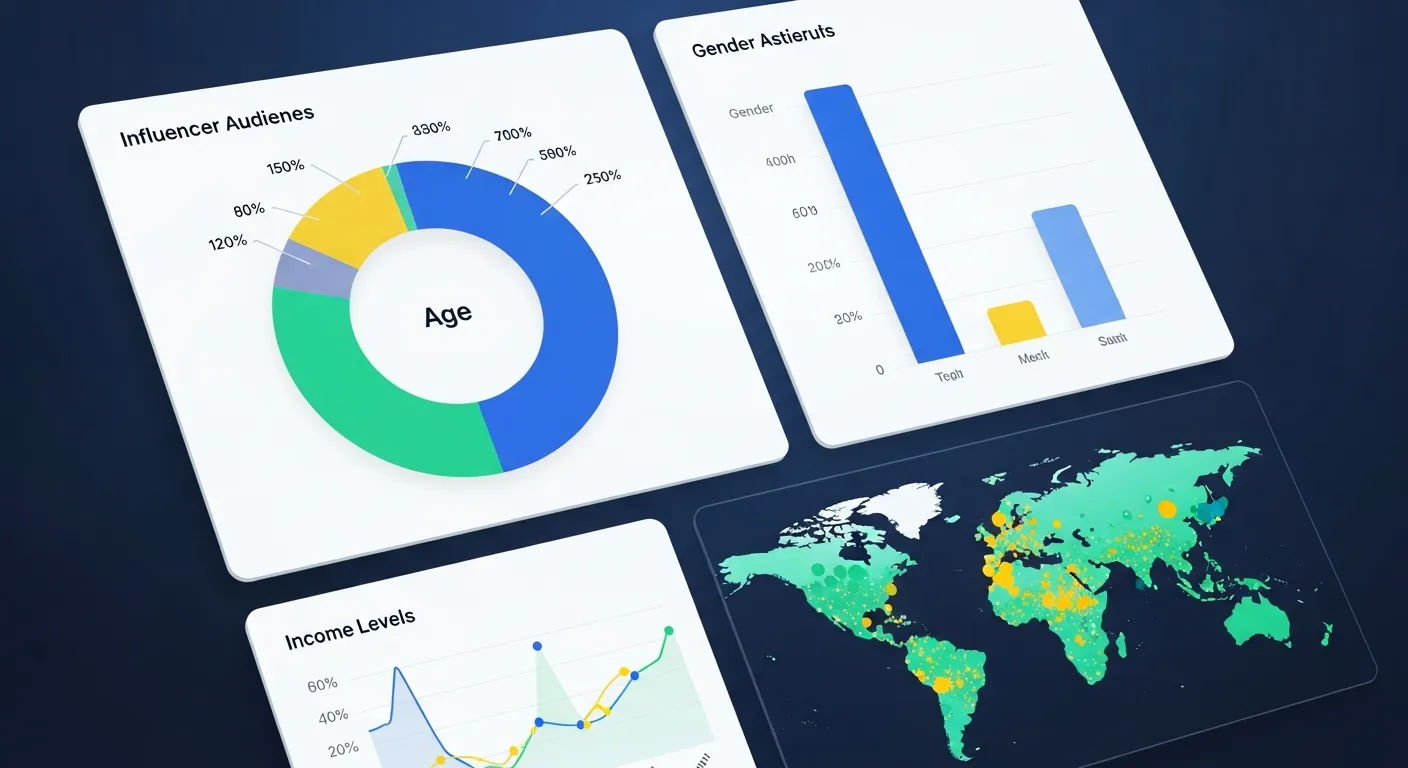
Understanding an influencer’s audience demographics ensures alignment with your target market. Review age, gender, location, interests, and purchasing behavior through platform insights or third-party analytics tools. Even high engagement is ineffective if the audience doesn’t match your ideal customer profile. Demographic analysis improves targeting precision, increases conversion potential, and reduces wasted budget on mismatched partnerships.
Influencer Authenticity and Credibility Score
Not all engagement is genuine. Evaluate authenticity by analyzing follower growth patterns, comment quality, audience consistency, and engagement spikes. Tools like HypeAuditor or Modash help detect fake followers and bot activity. Authentic influencers with loyal communities drive higher trust, stronger brand credibility, and better long-term ROI than those with inflated metrics.
Content Performance by Format
Different content formats perform differently across platforms. Compare metrics for Reels, Stories, carousels, live streams, and long-form videos. Short-form videos may drive reach, while in-depth reviews may boost conversions. By identifying top-performing formats, brands can guide influencers toward content styles that maximize engagement and sales impact.
Influencer Retention and Partnership Longevity
Long-term collaborations often outperform one-off campaigns. Track repeat campaign performance, audience familiarity, and cumulative engagement growth. Consistent partnerships build trust, reinforce messaging, and improve conversion rates over time. Measuring retention helps determine whether an influencer should become a long-term brand ambassador.
Customer Lifetime Value (CLV) from Influencer Campaigns
Instead of focusing only on immediate sales, evaluate how influencer-acquired customers perform over time. Calculate customer lifetime value to determine long-term revenue impact. High CLV indicates that influencer audiences align well with your brand and generate sustainable growth beyond initial conversions.
Influencer Campaign Attribution Models
Use multi-touch attribution models to understand how influencer marketing supports the full buyer journey. Some influencers create awareness, while others drive final conversions. Analyzing assisted conversions in tools like Google Analytics provides a more accurate view of campaign contribution beyond last-click attribution.
Crisis Monitoring and Risk Management
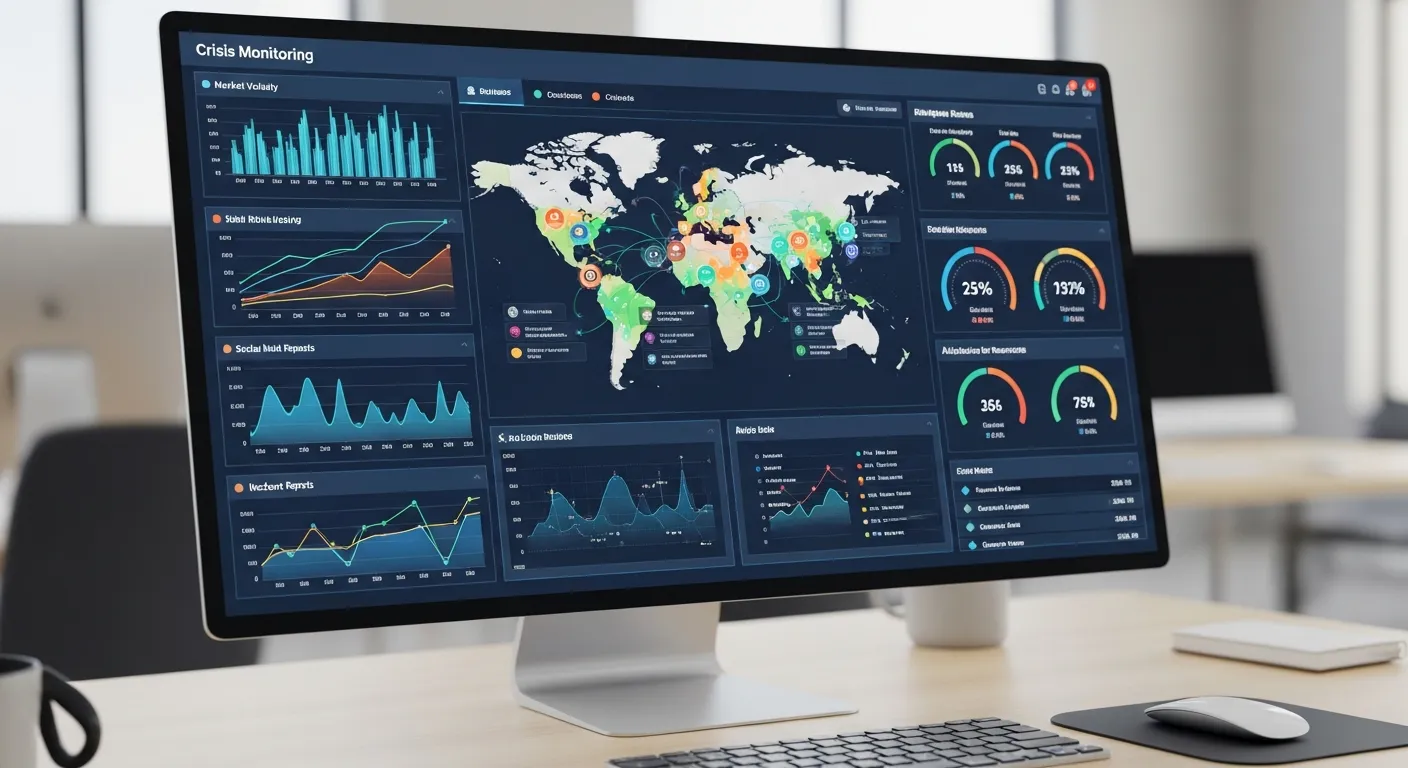 Influencer partnerships carry reputational risks. Monitor influencer behavior, public controversies, and audience reactions during campaigns. Establish clear contracts and brand guidelines to protect your reputation. Proactive monitoring ensures brand safety and allows quick response to negative developments.
Conclusion
Effective influencer marketing transcends vanity metrics and demands a strategic, data-driven approach. By tracking these ten essential KPIs—ranging from reach and engagement to cost per acquisition and ROI—you gain a comprehensive understanding of campaign performance and can optimize for maximum impact. Start by setting clear objectives, selecting robust analytics platforms, and benchmarking against industry standards. Regularly review and adjust your strategies based on the insights you gather, and cultivate relationships with influencers who resonate with your brand values and audience demographics. In doing so, you’ll not only elevate your influencer marketing campaigns, but also drive sustainable growth, build authentic connections, and deliver tangible business results that matter.
FAQs About Influencer Marketing Metrics
1. Why are influencer marketing metrics important?
Metrics help brands understand what’s working, what’s not, and how to improve. They also justify budget decisions and measure real ROI.
2. What is the difference between reach and impressions?
Reach = unique users who see the content.
Impressions = total views, including repeated views by the same person.
3. How do I calculate engagement rate?
Engagement Rate = (Total engagements ÷ Total reach) × 100.
It shows how actively the audience interacts with content.
4. Why is CTR important in influencer campaigns?
CTR shows how many viewers clicked a link or call-to-action. It’s key for measuring traffic and lead generation.
5. How do I track conversion rate from an influencer campaign?
Use UTM links, promo codes, and analytics tools to track how many clicks turn into purchases, sign-ups, or downloads.
6. What does CPA tell me?
Cost per Acquisition reveals how much it costs to gain each new customer or lead—helping compare influencer performance and spending efficiency.
7. How is brand sentiment measured?
Tools like Brandwatch and Sprout Social analyze comments and mentions to classify them as positive, neutral, or negative.
8. What is audience growth rate?
It measures how much your followers increase during a campaign. A higher rate means the influencer is effectively driving new audience interest.
9. What is share of voice in influencer marketing?
Share of voice shows how often your brand is mentioned compared to competitors within your niche.
10. How do I measure influencer marketing ROI?
ROI = ((Revenue from campaign – Total investment) ÷ Total investment) × 100.
Use affiliate links, tracking codes, or e-commerce analytics for accuracy.
11. How often should I review influencer metrics?
Weekly or monthly reviews help refine real-time strategy and prevent wasted budget.
12. Can small brands benefit from these metrics?
Absolutely—accurate tracking helps small brands scale smarter, choose the right influencers, and avoid overspending.