Decoding Engagement: Advanced Metrics for Your Influencer ROI

Modern influencer marketing success depends on more than likes or follower counts. Brands need to track deeper engagement metrics such as audience quality, meaningful interactions, CTR, and conversions. By using analytics tools and data-driven insights, marketers can identify high-performing influencers, optimize content strategies, and improve messaging. This ensures campaigns reach the right audience, create authentic engagement, and deliver measurable ROI.
Influencer marketing has evolved far beyond a simple numbers game. In the early days, brands chased follower counts, believing a larger audience automatically translated to greater impact. This approach, however, often led to disappointing results and a murky understanding of return on investment (ROI). Today, savvy marketers know that the real value lies not in the size of an influencer’s audience, but in the quality of their engagement.
To truly succeed, you must look past surface-level data like likes and comments. While these metrics offer a quick snapshot of audience interaction, they don’t tell the whole story. They fail to capture the depth of connection, the level of trust, and the actual influence an individual has over their followers’ purchasing decisions. Measuring the true impact of your campaigns requires a more sophisticated approach.
Beyond Likes: Why Vanity Metrics Fall Short
 For years, vanity metrics have been the default currency in influencer marketing. Likes, comments, and follower counts are easy to track and provide a seemingly straightforward way to gauge a campaign’s reach. However, relying on these numbers alone is a critical mistake. Learn more about Mastering Influencer Marketing Analytics.
First, these metrics are easily manipulated. The digital landscape is rife with “engagement pods” where users agree to like and comment on each other’s content to artificially boost visibility. Worse, bots can generate thousands of fake likes and comments, creating a misleading picture of an influencer’s popularity and reach. A high number of likes might look impressive, but it says little about genuine interest or audience loyalty.
Second, vanity metrics lack context. A post might receive thousands of comments, but are they substantive discussions or just a string of emojis and generic phrases? A high follower count is meaningless if those followers are not part of your target demographic or if they are inactive “ghost followers.” These metrics tell you that something happened, but they don’t explain what happened or why. They don’t reveal audience sentiment, brand perception, or purchase intent.
Ultimately, vanity metrics fail to connect influencer activity to real business outcomes. They don’t show how many people clicked through to your website, how many leads were generated, or how many sales were made. To calculate a meaningful ROI, you need to track metrics that demonstrate a clear link between the influencer’s content and your bottom-line goals.
Engagement Rate: The First Step Toward Deeper Analysis
The first step away from vanity metrics is to calculate the Engagement Rate. This metric provides a more nuanced view than raw numbers by measuring the percentage of an influencer’s audience that interacts with their content. It helps you understand how active and responsive an influencer’s community truly is.
How to Calculate Engagement Rate
There are several ways to calculate engagement rate, each offering a slightly different perspective.
- Engagement Rate by Reach (ERR): This is often considered the most accurate formula because it measures engagement against the number of unique people who actually saw the post.
- Formula: (Total Engagements per Post / Reach per Post) x 100
- When to use it: Ideal for assessing the effectiveness of individual posts, as it’s not skewed by follower count. A high ERR indicates that the content was highly compelling to those who saw it.
- Engagement Rate by Posts (ER Post): This formula measures the engagement of a single post against the influencer’s total number of followers.
- Formula: (Total Engagements on a Post / Total Followers) x 100
- When to use it: Useful for a quick comparison of engagement across different posts from the same influencer or between influencers with similar follower counts. However, it can be misleading since not all followers will see every post.
- Engagement Rate by Impressions (ER Impressions): This measures engagement relative to the total number of times a post was displayed, regardless of whether it was seen by unique users.
- Formula: (Total Engagements on a Post / Total Impressions) x 100
- When to use it: Helpful for paid campaigns where you want to understand the engagement relative to total ad delivery.
While engagement rate is a significant improvement over simple likes and comments, it’s still just the beginning. It tells you that people are interacting, but it doesn’t reveal the quality or nature of those interactions.
Advanced Engagement Metrics You Should Be Tracking
![]() To gain a truly comprehensive understanding of your influencer marketing ROI, you need to dig deeper into metrics that reflect the quality of engagement and its impact on your brand.
To gain a truly comprehensive understanding of your influencer marketing ROI, you need to dig deeper into metrics that reflect the quality of engagement and its impact on your brand.
True Reach and Audience Quality
Before you even consider engagement, you must verify the quality of an influencer’s audience. A large following is worthless if it’s composed of bots or people outside your target market.
- Audience Demographics: Use influencer marketing platforms or ask influencers for their analytics reports to get data on their audience’s age, gender, location, and language. Does this align with your ideal customer profile?
- Follower Growth Rate: A steady, organic growth pattern is a positive sign. Sudden, massive spikes in followers could indicate that the influencer purchased followers. Tools like SocialBlade can help you track this over time.
- Audience Credibility: Specialized tools can analyze an influencer’s followers and estimate the percentage of real, active users versus bots or ghost followers. Aim for partners with a high percentage of credible followers.
Qualitative Engagement Analysis
This is where you move from counting engagements to understanding them. It involves a manual or AI-assisted review of the comments and conversations happening around an influencer’s post.
- Sentiment Analysis: Are the comments positive, negative, or neutral? High engagement is great, but not if the comments are critical of your brand or the influencer’s partnership. Look for genuine enthusiasm, positive feedback, and brand advocacy.
- Comment-to-Like Ratio: A high number of thoughtful comments relative to likes can indicate a deeply engaged and loyal community. Generic comments like “Nice!” or a string of fire emojis are less valuable than questions about the product or personal testimonials from other users.
- Shares and Saves: These actions are a powerful indicator of value. When someone shares a post, they are endorsing it to their own network. When they save it, they are signaling an intent to revisit it later. Both actions suggest a much higher level of interest than a simple like.
Conversion and Performance Metrics
Ultimately, the goal of most marketing efforts is to drive business results. Tracking conversion metrics connects influencer activity directly to your bottom line.
- Click-Through Rate (CTR): This measures the percentage of people who clicked on the link in an influencer’s post or bio. It’s a direct measure of how effective the influencer was at driving traffic to your desired destination, whether it’s a landing page, product page, or blog post.
- How to track: Use unique, trackable links (like UTM codes or Bitly links) for each influencer.
- Conversion Rate: This is the percentage of users who completed a desired action after clicking through from an influencer’s post. This action could be making a purchase, signing up for a newsletter, downloading an app, or filling out a lead form.
- How to track: Set up conversion goals in your analytics platform (e.g., Google Analytics, Shopify Analytics) and use UTM parameters to attribute conversions back to specific influencers.
- Cost Per Acquisition (CPA): This metric tells you how much it cost to acquire a new customer through an influencer campaign.
- Formula: Total Campaign Cost / Number of Conversions
- Why it’s important: CPA helps you evaluate the financial efficiency of your campaign and compare the performance of different influencers.
Calculating the True ROI of Your Influencer Campaigns
With these advanced metrics in hand, you can move beyond guesswork and calculate a tangible ROI.
Earned Media Value (EMV)
EMV is a metric used to estimate the monetary value of the exposure you gained from an influencer campaign. It essentially asks: “How much would we have had to spend on traditional advertising to achieve the same reach and engagement?”
While there’s no single industry standard for calculating EMV, a common approach involves assigning a value to different types of engagements (likes, comments, shares, video views) based on industry benchmarks for paid advertising. Many influencer marketing platforms have built-in EMV calculators.
Return on Investment (ROI)
The most direct way to measure your campaign’s success is to calculate ROI.
- Formula: [(Financial Gain from Investment – Cost of Investment) / Cost of Investment] x 100
- Applying it to influencer marketing:
- Financial Gain: This is the revenue generated directly from the campaign, tracked via conversion metrics.
- Cost of Investment: This includes the influencer’s fee, the cost of any free products provided, agency fees, and any other associated expenses.
A positive ROI means your campaign generated more revenue than it cost. This formula provides a clear, data-backed justification for your marketing spend.
From Data to Decisions: Optimizing Your Strategy
 Tracking these advanced metrics is not just an academic exercise. The insights you gather should inform every aspect of your future influencer marketing strategy.
- Refine Influencer Selection: Use performance data to identify your top-performing partners. Double down on relationships with influencers who drive high-quality engagement and conversions, and reconsider partnerships that don’t deliver results.
- Optimize Content Strategy: Analyze which types of content (e.g., tutorials, unboxings, testimonials) generate the best engagement and conversion rates. Use these insights to guide your creative briefs for future campaigns.
- Improve Offer and Messaging: A/B test different offers, calls-to-action, and landing pages to see what resonates most with different influencer audiences. A small tweak to your messaging can have a significant impact on your conversion rate.
A Smarter Path to Influencer Marketing Success
The era of measuring influencer marketing success by follower counts and likes is over. To build a sustainable and profitable strategy, you must adopt a more sophisticated, data-driven approach. By focusing on advanced metrics like qualitative engagement, audience quality, and conversion rates, you can move beyond vanity and measure what truly matters: the impact on your brand and your bottom line.
This journey from basic likes to comprehensive ROI analysis requires effort, but the payoff is immense. It allows you to make smarter decisions, build more authentic partnerships, and prove the tangible value of your influencer marketing investments. Start decoding engagement today and unlock a new level of success for your brand.
Conclusion
The landscape of influencer marketing has transformed dramatically, and success now demands far more than tracking likes or follower counts. To build campaigns that deliver real business impact, brands must embrace a data-driven approach that prioritizes audience quality, authentic engagement, and measurable performance. By looking beyond vanity metrics and focusing on advanced indicators such as sentiment analysis, true reach, click-through rates, conversions, and ROI, marketers gain a deeper understanding of what truly drives results.
This shift allows brands to make smarter investment decisions, refine their messaging, and strengthen partnerships with high-performing influencers. Instead of relying on guesswork, your strategy becomes guided by concrete insights that reveal what content resonates, which influencers have genuine influence, and where the greatest opportunities for growth exist.
Ultimately, influencer marketing success comes from combining creativity with analytics. When you pair compelling content with meaningful measurement, you transform influencer collaborations into powerful engines for brand awareness, trust, and revenue. By continuously optimizing your approach, you not only enhance campaign performance—you unlock a sustainable, scalable path to long-term marketing success.
Frequently Asked Questions
What is a good engagement rate?
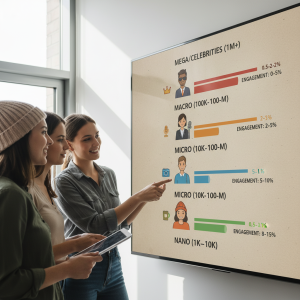
There’s no single answer, as “good” varies significantly by platform, industry, and an influencer’s follower count. Generally, smaller influencers (nano and micro-influencers) have higher engagement rates than macro-influencers and celebrities. For Instagram, an engagement rate of 1-3% is often considered average, while anything above 3% is good, and above 6% is excellent. However, you should always prioritize the quality of engagement over the raw percentage.
How can I track shares and saves on Instagram?
If you are working with an influencer who has a Business or Creator account, you can ask them to share screenshots of their post insights. These analytics provide detailed data on reach, impressions, shares, saves, and website clicks. This level of transparency is a hallmark of a professional and trustworthy partner.
Is it better to work with a few large influencers or many smaller ones?
It depends on your goals. Macro-influencers can offer massive reach and are great for top-of-funnel brand awareness campaigns. However, micro-influencers (typically 10k-100k followers) often boast higher engagement rates, a more niche audience, and greater perceived authenticity. They can be incredibly effective for driving conversions and building community trust. Many brands find success with a tiered approach, using a mix of influencer sizes to achieve different objectives.